The Magic of The Elliott Wave Principle
So you have come here looking for the elusive magic of The Elliott Wave Principle in forex market! It was Robert Balan, an old friend, who once said “Can anyone parlay a $10,000 capital into $1,000,000 in a year? In five years? If so, how do you do it and what are the risks involved?”
I have been practicing Elliott Wave Analysis for over 35 years, and have made some astounding calls that came true. But I cannot honestly say that I was able to turn a mere $10,000 into a million dollars. Yet, I can confidently say that there are very few technical approaches to dealing with the uncertainties of the market place as efficiently as does the Elliot Wave Principle.
I am not going to give you the rules and guidelines governing the practice of Elliot Wave Theory. There are ample resources in the web that you can access at the click of your mouse. What I will do, instead, is to give you one example now, and show you the working of the magic of the Elliot Wave Principle in the Forex market.
Elliott Wave Analysis of Sterling Pound
You see here two charts of Sterling Pound (GBP/USD). The first is a monthly chart going back to the early 1980s. The second is a daily chart going to Oct 2007. The magic of the Elliott Wave Principle is that it works equally well in the monthly chart as it does in the 5-minute chart! Having said that, I must also add that you should not try to day-trade using the monthly chart!
For example, the monthly chart suggests that our long-term target for the Pound is around 1.3300 (We have already reached 1.3498) but the daily chart points to a significant recovery, perhaps reaching as high at 1.6170 before down. Of course, there are several risk levels on the way, for example, it might run into considerable selling pressure near 1.4900.
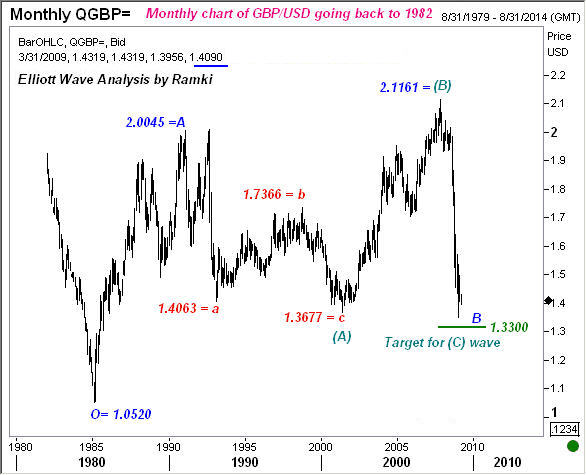
Let us suppose that we are now in the early 1990s and have already seen the first big move from 1.0520 to 2.0045 (Point A). When the second attempt failed to sustain above that level, we should have anticipated a swift move down. Remember that the third step of any progression is always a powerful move. We could have easily calculated that a 61.8% Fibonacci retracement of the Wave “A” would lie at 1.4158. The move actually finished at 1.4063.
Next consider the “c” wave that went from 1.7366 to 1.3677. Believe it or not, but that move was just 7 pips short of the 61.8% measure of the “a” wave. But the Elliott Wave magic doesn't stop there. Wave “B” that went from 1.3677 to 2.1161 was only 2 pips short of 78.6% of wave “A”. The Elliot Wave Principle asks us to always be on the lookout for Fibonacci relationships between alternating waves.
Finding the magic in the Elliott Wave charts
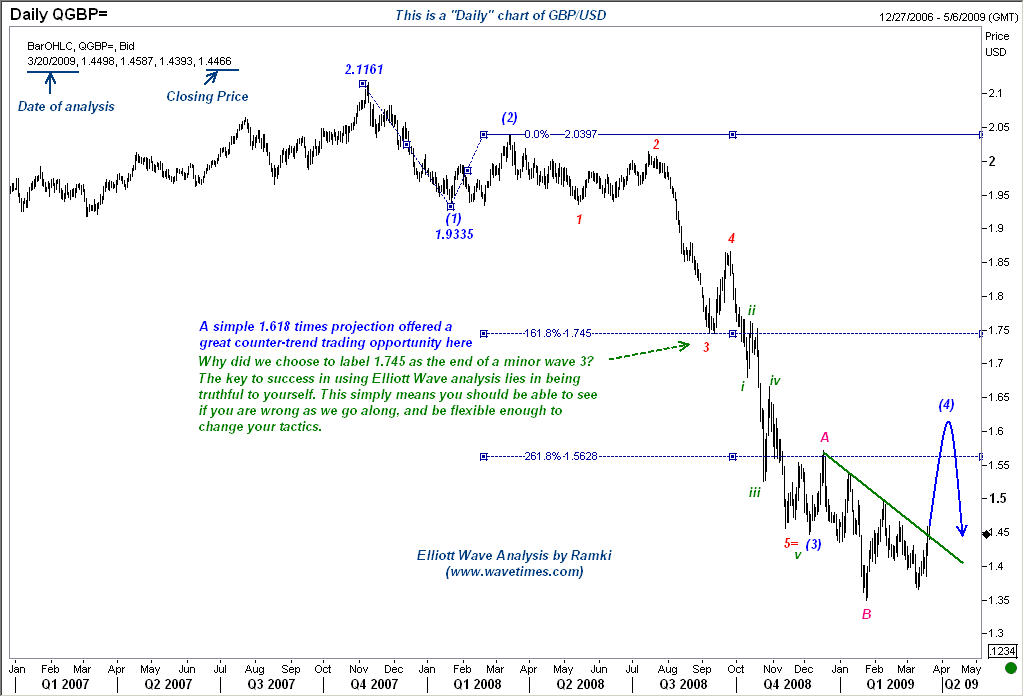
Now let us turn to the daily chart. This is a lot more interesting. As you can see from the comments on the chart, one could have placed a low-risk “buy” trade near 1.7450 as it marked a 161.8% projection of the first wave down. One of the problems that many beginning-analysts face is how to pick a level and call it the end of a certain wave? For example, how did I label the 1.7450 level as a mini wave 3?
With hind sight it all looks so good, but how on earth can one figure out that we will not break directly down? (See for example how the 261.8% level at 1.5628 did not hold). Welcome to the real world of Elliott Waves! The key to lasting success in the business of trading is to be honest to your paradigm. Follow your rules (whatever they may be) to the letter. The biggest sin that a trader can commit (second only to not having a stop loss) is to keep changing his rules.
Take a look at the chart again. When you get a fast sell off, you should calculate various projections and keep them by your desk. I would have known that 1.7450 was a likely (but not certain) support. I would not buy there the first time. Typically, in a fast-moving market, we will always get a retest of the lows.
If the market stabilized near a Fibonacci projection at the first try, I would place a small 'buy' order near the prior low with a stop just a few pips below that low. As you can see, we got a second test of 1.7450 two or three days after the first try. Since the buying interest was strong at that level, the trade paid off handsomely. (Another tip: When doing Elliott Wave analysis, I recommend that you depend on daily charts more than hourly charts to figure out supports and resistances).
Let us look to the future now. Why do I think we could go higher to around 1.6170? First of all, you should understand that in order to make money, it is not so important to know the medium-term targets as it is to know the general direction! What if we don't get as far as 1.6170. Most traders would be just as happy to catch a move to 1.4900! Anyway, back to the question.
We saw that Wave (2) at 2.097 was a 'simple' correction. This means there is a high probability for wave (4) to be a complex one. We have already seen that the “B” wave (as labeled by me) is an irregular correction, with the low coming well below the end of the Wave (3).
If you accept this count as valid (and remain truthful to that count until proved wrong) then you should look for the Wave “C” within the Wave (4) to go well above the top of the wave “A.” Besides, the second test of the low seen AFTER posting the “B” wave bottom was unable to break the prior low.
And finally, we not only saw a strong move higher, but it has managed to break above a declining (green colored) downtrend line. These are just some of the reasons why I am looking for Sterling to continue moving higher.
If one only worries about being 'correct' in making market calls, one will never be a good trader.
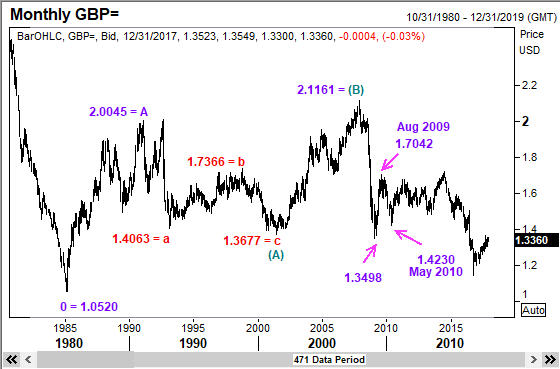
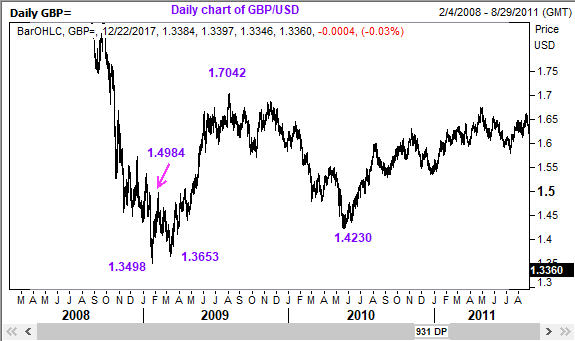
Below I am producing some additional charts of GBP to show you how thinigs turned out. As you will observe, the Sterlin Pound did rally quite nicely.
Final Thoughts
It is vitally important to have an open mind about these things. Consider this. I have a market reputation and will look silly if the Pound stops climbing and goes down directly. Should I allow that to bother me? If one only worries about being 'correct' in making market calls, one will never be a good trader.
A trader must study his charts and make the most educated prediction about what will happen next. He should then execute his plan of action without wavering one bit. This includes having an affordable stop-loss, as well as plans to take profits along the way. There is no other way to riches. To benefit from the magic of the Elliott Wave Principle in forex market, one has to combine wave analysis with money management.
This article was originally published in FX Trader Magazine in their April 2009 issue.
Quick Question: Did you wish that you could learn directly from me on how to trade using Elliott Waves? Then you need not wait any longer. I have published what is now being acknowledged as the BEST course available online for traders. Listen to the testimonials and you will hear how this course has changed their trading approach so much for the better.
Recent Posts
Recent Comments
No comments to show.