As a trader, you might be interested in learning how to identify and trade a leading diagonal triangle. This article explains in detail exactly how to do this, using real-life examples of Gold.
What Is A Diagonal Triangle?
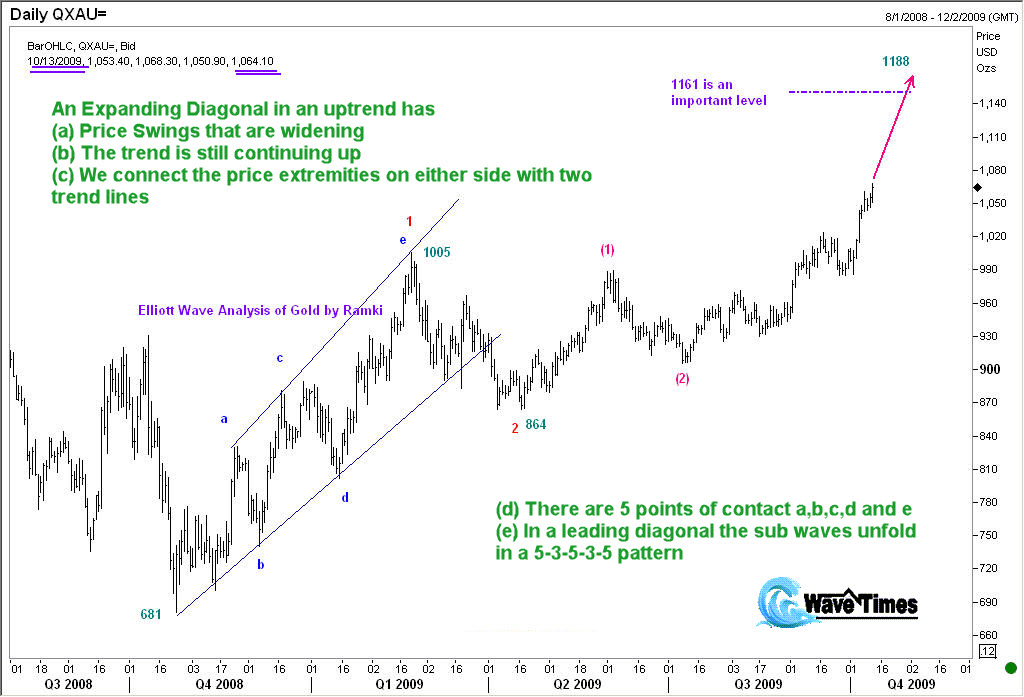
A converging diagonal triangle is a chart pattern where you will observe the price swings are narrowing with the passage of time while continuing its present trend. The converse is true with an expanding diagonal triangle.
Thus, in an expanding diagonal triangle in an uptrend you will find the following:
- Price Swings are widening.
- The trend is continuing up.
- When you connect the extremities of these price swings with two trendlines, one on either side of these price swings, you will get a wedge-like pattern, and this pattern is what Elliott Wave analysts describe as a diagonal triangle.
- In a leading diagonal triangle, there will be 5 points of contact with the trendlines, usually designated by the letters a, b, c, d,and e.
- These 5 sub waves develop in a 5-3-5-3-5 pattern. What this means in sub waves a, c and e will be made up of 5 minor waves, whereas sub waves b and d will be made up of 3 minor waves each.
- A diagonal triangle is where we will allow an exception to the rule that wave 4 should not overlap the top of wave 1.
The above description of a leading expanding diagonal triangle is illustrated with the following chart of Gold.

Where Do We Usually Identify A Leading Diagonal Triangle?
A leading diagonal triangle is found either in a wave 1 position, or in wave A position. It is called a leading diagonal because it is the initial formation of a much larger move in a new trend, either up or down. That means, once the leading diagonal triangle completes its five-wave progression, it will experience a correction. After that, we will get a much stronger move in the same direction as the leading diagonal triangle.
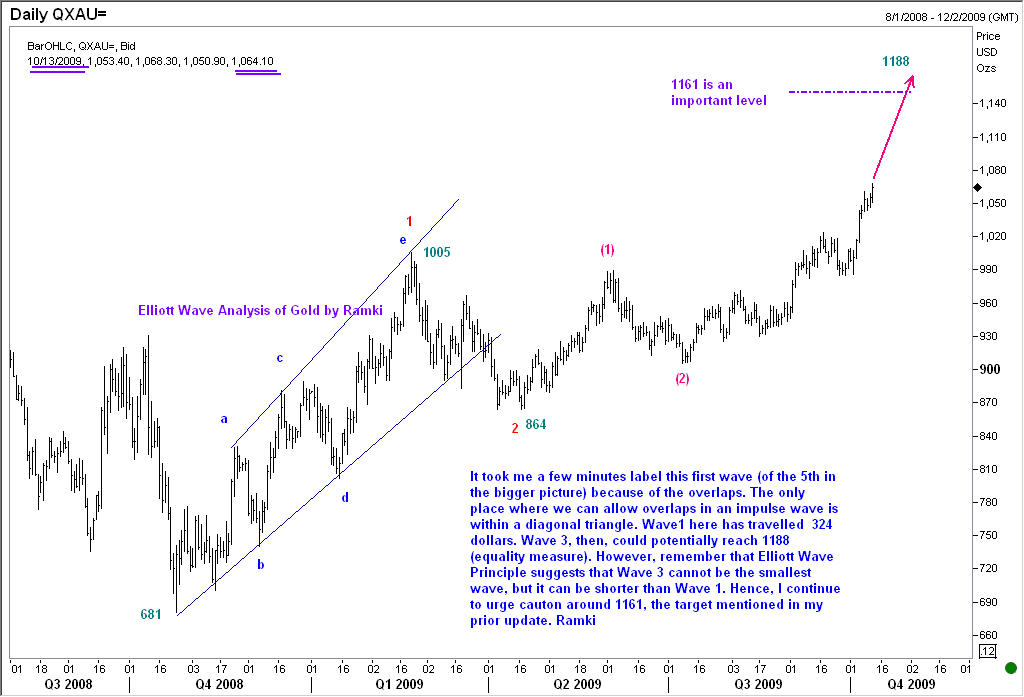
Almost a month back, I wrote in these pages that Gold will stay bid until it reaches at least 1069, and if sentiment remains strong, we could even see 1161. At that time, the precious metal was trading at 1016. Today, Gold has reached a record high and met that first target at 1069, and has edged back to 1057 as I am writing this special update for you.
If you are an investor, or a trader in Gold, it is vitally important for you to know which direction the metal is heading in the medium term, and estimate how far the move could travel.
There are few better tools available to you than a sound knowledge of Elliott Wave Principle. With wave analysis, you will also be able to see any error in judgement much sooner than otherwise. Unfortunately, it takes several years of patient study before one can become deft at calling turns. Even a battle-scarred veteran like me makes mistakes. So, a beginner must be careful. Still, it is worthwhile to study the wave principle carefully.

What clues can we get to trade this Leading Diagonal Triangle from its current position?
Today’s chart shows a leading diagonal triangle in Gold. This is a rare formation but, given its position in the progression, the outcome was clear that we would get a smart move higher. Now that we have reached the first target at 1069, it is time to consider whether Gold still has room on the upside. My assessment is YES.
If we get a quick dip to around 1040, one should continue to buy. There are more supports near 1020. From one of these supports for Gold, we should expect at least a retest of the highs. Once we get past 1069 by more than a few dollars, a move to 1161 should not be too difficult.
At this point, I would like to share with gold traders a key point in wave analysis. When a five-wave move is finished, the ensuing correction will not only correct the fifth wave, but the entire cycle of five waves. Hence, it will travel a greater distance than either wave 2 or wave 4 in the prior cycle. Wave 4 was 349 dollars. So, our correction will be at least 349 dollars. It will serve you well to keep that in mind.
However, when we are in a wave 3, there is always a possibility that we will get an extension. Remember, at least one of the three impulse waves in a trend will likely see an extension, which is, by definition, a move of abnormal length. So, picking tops to sell in the anticipation of a third wave ending at a Fibonacci target is not advisable.
Given the current sentiment in the market, I think we will remain bid for several days, and even if you buy at 1020-1040 window, you will get enough opportunities to exit at a profit, even if that profit is not going to make you as rich as you will be if gold reaches 1161. In any case, I will try and alert you if something changes while we wait.
Final Thoughts.
In this article we explained how to identify a leading diagonal triangle, and where it is likely to be seen. We discussed the distinguishing features of this important chart pattern. The leading diagonal triangle is made up of 5 sub waves. These sub waves will develop in a 5-3-5-3-5 pattern for its minor waves.
We will also see overlaps of sub wave 4 over the top of sub wave 1. Leading diagonal triangles can be either a regular, i.e., contracting diagonals, or expanding diagonals.
We have illustrated these concepts with a clearly labeled real-life example of Gold. We also then discussed the moves that will come after we get a correction of the leading diagonal.
In the case of Gold, we made some projections of how high the move could continue up. But we warned the readers that it is never safe to pick tops and sell during a wave 3 rally. That is because wave 3 could extend and go much higher than the standard Fibonacci targets for a normal third wave. All said and done, the leading diagonal triangle offers some very useful clues about the subsequent moves. Traders should learn how to spot and trade them as the rewards will be significant.
If you love my Elliott Wave book “Five Waves to Financial Freedom“, then you will love my online course even more! That course will take your understanding of Elliott Waves to a whole new level. It teaches you how to APPLY what you learn in my book to actually make trading profits in the markets. The concept of identifying and trading the leading diagonal triangle are all covered in great detail. I have personally recoded the course content using high-definition videos so that you will see everything clearly.
